
How Body Composition Changes Over Time, and What a BMI Number Actually Reflects
A BMI of 22 means the same thing mathematically at every age; it's still just weight divided by height squared. What can genuinely differ is the body composition behind that number. Muscle mass tends to decline gradually with age while fat mass tends to increase, even when total weight stays constant, which means an identical BMI at 25 and at 55 doesn't necessarily represent an identical body.
This guide covers how body composition shifts across a woman's lifespan, what the standard BMI range actually is, a verified height-specific reference chart, and what tends to matter alongside the number rather than treating BMI as a fixed identity to chase.
How BMI Interpretation Shifts With Age
The BMI formula itself never changes. What changes with age is the body composition typically behind a given number. As women age, metabolism gradually slows, and the ratio of muscle to fat tends to shift even when total weight remains stable, which is why the same BMI figure at 25 and at 55 can represent meaningfully different bodies.
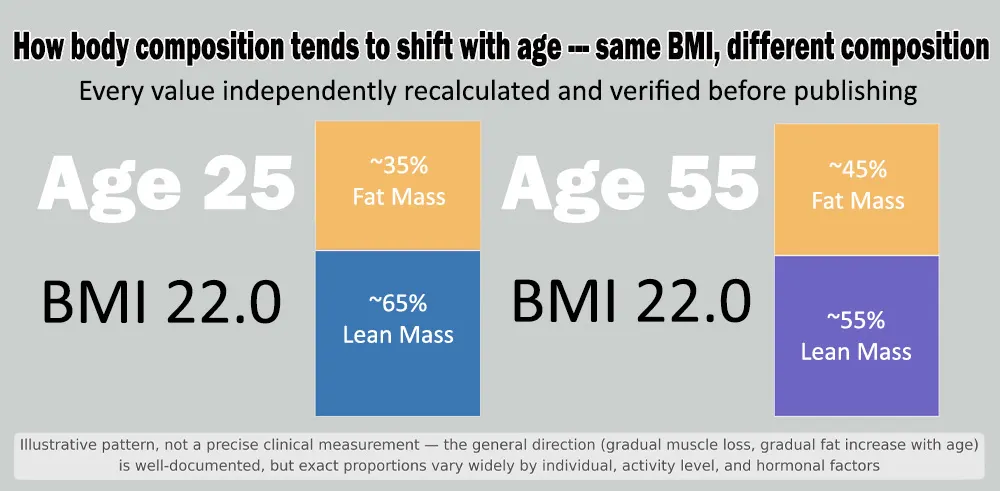
Figure 1: An illustrative pattern of how body composition can shift with age at an unchanged BMI. This shows the general direction supported by research — actual proportions vary substantially by individual, activity level, and hormonal factors, and shouldn't be read as a precise personal prediction.
A note on precision here: some sources present specific numeric BMI ranges for each decade of a woman's life, a different 'healthy' range at 25 than at 45 than at 55, for instance. That level of specific, tiered numeric guidance isn't something backed by the major health authorities (WHO, CDC, NHS), which maintain a single standard adult BMI range across ages, alongside general research-based discussion — not a formal decade-by-decade breakdown that BMI may warrant somewhat more flexible interpretation in older adults specifically. Presenting an invented set of precise numeric brackets by age would overstate what's actually established. What is well-supported is the broader pattern: body composition shifts gradually with age, and that shift is part of why a single BMI reading tells an incomplete story on its own.
The Standard BMI Range for Adult Women
The standard adult BMI categories, used consistently by the WHO, CDC, and NHS, apply across the general adult population: underweight below 18.5, normal weight from 18.5 to 24.9, overweight from 25.0 to 29.9, and obese at 30.0 and above.
These categories don't formally change by age within the standard adult range. What does change is the context typically applied when interpreting a result, particularly for older women, where a modestly elevated BMI is sometimes discussed in geriatric research as carrying different implications than the same figure would for a younger woman, and during pregnancy, when standard categories don't apply at all and specialized prenatal guidance is used instead.
A 30-year-old woman at 165 cm and 60 kg calculates to a BMI of approximately 22.0, comfortably within the standard healthy range, and straightforward to interpret at that life stage.
BMI Reference Chart for a 5'5" Woman
Height-specific charts make it easier to see how relatively small weight changes move a BMI value between categories. At 5'5," a commonly searched height, the shift from one category to the next can happen within a 10 to 15 pound range.
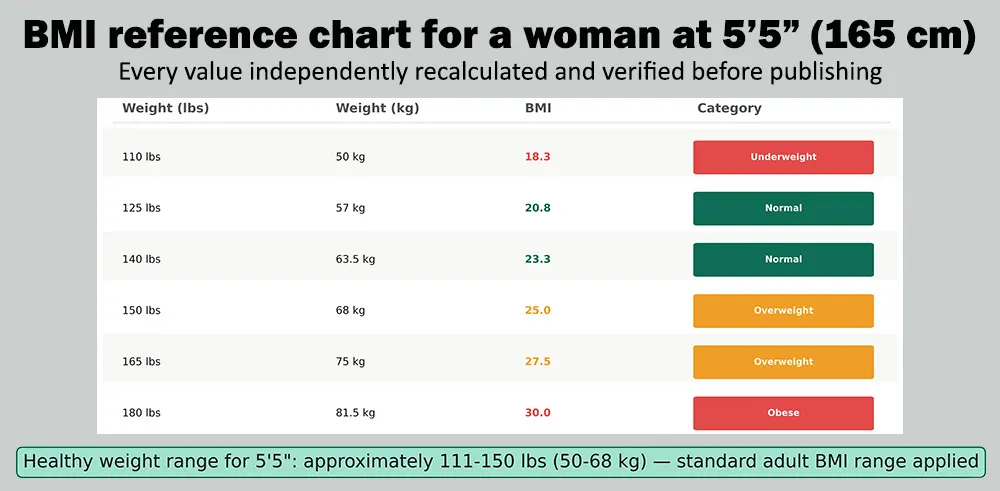
Figure 2: Every figure in this chart was independently recalculated using the standard imperial BMI formula before publishing, to confirm accuracy rather than carrying forward unverified numbers.
The standard healthy weight range at this height works out to approximately 111 to 150 pounds (roughly 50 to 68 kg), the weight range that maps to a BMI between 18.5 and 24.9. Movement between categories at this height is genuinely sensitive to small changes, which is worth keeping in mind when interpreting a single reading rather than a trend.
Why the Same BMI Can Mean Different Things
Two women can share an identical BMI and have genuinely different bodies a structural limitation of the formula itself, not an inconsistency in how it's applied.
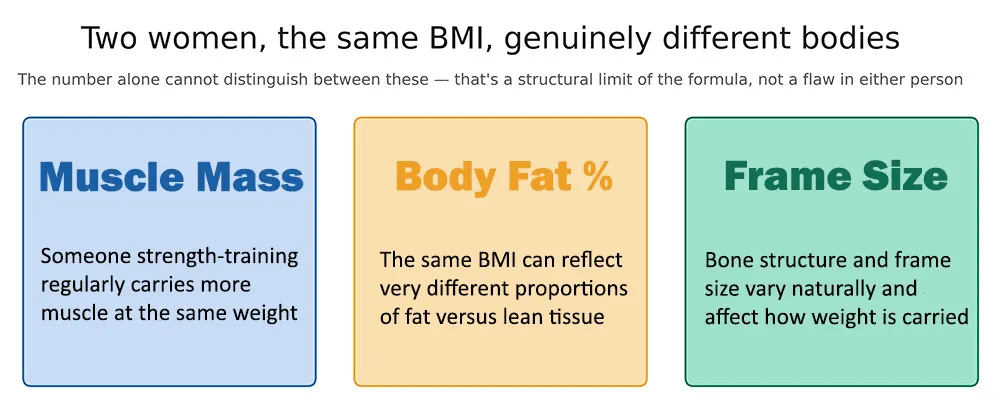
Figure 3: Muscle mass, body fat percentage, and frame size all affect how a given BMI value translates to an actual body — and none of these are things the BMI formula can see.
A woman who strength-trains regularly will typically carry more muscle mass at a given weight than one who doesn't, even at an identical BMI. Body fat percentage can vary substantially between two women with the same BMI. Frame size, bone structure, and build vary naturally and affect how a given weight is distributed and carried. None of this means BMI is meaningless; it means the number works best as one data point among several, not a complete assessment on its own.
What to Track Alongside BMI
Rather than treating a single BMI figure as the goal, several other measures tend to provide more day-to-day, individually meaningful information.
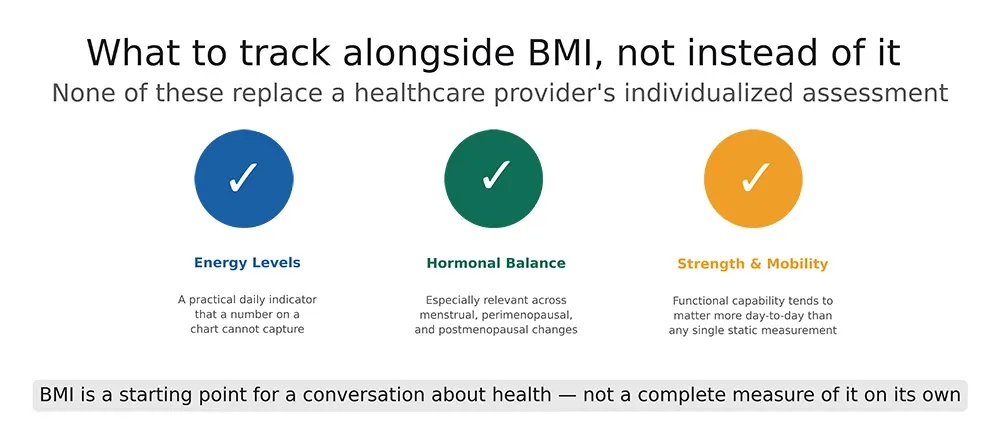
Figure 4: Energy levels, hormonal balance, and strength and mobility each capture something a height-and-weight ratio structurally cannot — none of them replace a healthcare provider's individualized assessment, but together they offer a fuller picture than BMI alone.
Energy levels: a practical, felt indicator of how well the body is functioning day to day, independent of what any chart shows.
Hormonal balance: particularly relevant across the menstrual cycle, during perimenopause, and after menopause, when hormonal shifts affect body composition independent of any change in total weight.
Strength and mobility are functional capability that tends to matter more for quality of life, at any age, than a static number on a chart.
Frequently Asked Questions
Does the healthy BMI range change with a woman's age?
The standard adult BMI categories (18.5–24.9 for normal weight) don't formally change with age within general adult guidelines from the WHO, CDC, or NHS. Some geriatric research discusses a more flexible interpretation of BMI for older adults broadly, but this isn't the same as a specific, separate numeric range assigned to each decade of life; that level of precision isn't supported by major health authorities.
What is a healthy weight for a 5'5" woman?
Approximately 111 to 150 pounds (roughly 50 to 68 kg), corresponding to the standard BMI range of 18.5 to 24.9 at that height. This is a population-level guideline, not an individual prescription; actual healthy weight varies by muscle mass, frame size, and overall health context.
Can two women have the same BMI but look completely different?
Yes, and this is one of BMI's most consistently cited limitations. Muscle mass, body fat percentage, and frame size all affect how a given BMI translates into an actual body, and the formula has no way to distinguish between them.
Why might BMI be interpreted differently for older women?
Some geriatric research has explored whether a modestly higher BMI may carry different implications for older adults, related to reduced frailty risk. This remains an actively studied and debated area rather than a settled recommendation, and it doesn't translate into a specific, agreed-upon numeric target that differs by decade.
Should BMI be the main measure used to track health as a woman?
No, it's a reasonable starting screening signal, not a comprehensive health measure. Energy levels, hormonal balance, strength, mobility, and a healthcare provider's broader clinical assessment together provide meaningfully more complete information than BMI alone.
Conclusion
BMI doesn't recalculate itself with age; the formula stays constant from 20 to 70. What changes is the body composition typically behind a given number, and how much context is needed to interpret it meaningfully. A woman's BMI at 55 deserves the same formula and a different reading than the identical number at 25, because muscle mass, hormonal changes, and fat distribution have likely shifted even if the weight on the scale hasn't.
The verified reference chart in this guide reflects real, recalculated numbers useful for understanding how weight and BMI relate at a specific height. What it can't capture is muscle mass, frame size, hormonal context, or how someone actually feels day to day, which is exactly why those measures are worth tracking alongside BMI rather than being replaced by it.
BMI is a starting point for a broader conversation about health most usefully had with a healthcare provider who can weigh the number alongside everything it can't see on its own.